Marker Table
The Marker Table allows you to view, add and edit information (e.g. marker set, wellbore, easting, northing, depth, MD, in model data status, type) for all markers coupled to wellbores in your model. The table shows you the exact physical locations of all markers along their respective wellbores, and it allows you to edit these locations manually through changing the MD location along each respective wellbore. As you make changes to the markers in this table, any open Thickness Table and Well View is immediately updated with the change. You can also control, via the 'Use for modeling' checkboxes, which well markers you want to include in the various modeling processes where markers are used as input.
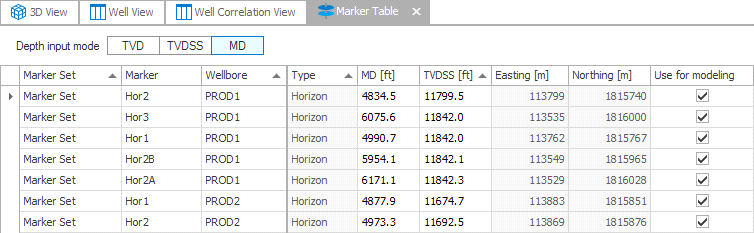
Marker table click to enlarge
The Marker Table
The markers visible in the table are controlled from the JewelExplorer; the table shows only the markers for the wells, marker sets and marker for which the checkboxes are checked in the JewelExplorer. By default, the Use for modeling checkbox is checked for each of the markers. This means the marker is incorporated in the various modeling processes where markers are used as input, such as building of the structural model, well matching, or adding a marker-based surface to the 3D grid. When you uncheck the box (or when the option is grayed-out because the In model data option is toggled off in the context menu of the wellbore or well in the JewelExplorer), the marker will not be incorporated as input to these modeling processes and will be ignored.
For solutions with many wells and markers, you can use well grouping and filtering to easily display relevant data in the table. Like most data tables, all of the data can be sorted by column, either by clicking the column header to change the sort order or by right-clicking the column header for advanced options. These options are detailed in the table below.
By default, the markers displayed in the table are sorted per marker set and well, in stratigraphic order. Some information, such as the Dip, Dip Azimuth and MD, can be edited in the table by double-clicking the cell and providing a new value. Other information, such as easting and northing, is read-only. The table can also be used to create marker sets and markers for your solution. See below for further information.
The following information is available for each marker:
Marker Set The name of the selected marker set(s).
Marker The name of the marker.
Wellbore The wellbore the marker is coupled to.
Dip The dip of the surface that the marker represents. This data can be edited.
Dip Azimuth The dip azimuth of the surface that the marker represents. This data can be edited.
Missing The value in this column relates to the thickness of the missing or overlapping interval. The value needs to be entered manually. See Defining gaps or overlaps due to fault offset or an unconformity.
Depth, Northing, Easting The depth (TVD, TVDSS and MD), Easting and Northing location of the marker.
Use for modeling By checking the checkbox in the Marker Table, the marker is incorporated in the various modeling processes where markers are used as input, such as building of the structural model, well matching, or adding a marker-based surface to the 3D grid. An unchecked box indicates that the marker will not be used in those modeling processes and will be ignored. If the checkbox is disabled (grayed-out) for a particular marker or group of markers, this indicates that the In model data toggle (context menu option on the well/wellbore in the JewelExplorer) of the corresponding well is toggled off, and all markers of the well are excluded. Toggle In model data on to enable the checkboxes in the Marker Table.
Type The type of surface the marker is representing.
Constrain to The surface to which the marker is constrained in case the marker is a constraint marker.
Constraint weight The weight used for the constraint in case the marker is a constraint marker.
Bound to When a horizon well marker and a fault well marker are bound (i.e. 'coupled'), this column displays the marker that the relevant marker is bound to.
Right-click column header options
More options for sorting data in this table are available by right-clicking the column header area and selecting from the context menu:
Sort Ascending Sorts the selected column in ascending order.
Sort Descending Sorts the column in descending order.
Clear sorting Clears the sorting.
Group By This Column Allows you select a column heading for grouping the mapping information. When grouped, the mapping information is arranged in a tree structure under one of the column heading categories. To clear grouping, right click the table header and select Clear Grouping from the context menu.
Show/Hide Group by Box Opens a box at the top of the table that can be used for grouping the information by category. Drag a column heading into the indicated field and the table will be grouped under that category (e.g., if you select Wellbore, it will be organized into a tree structure by Wellbore). You can turn the grouping view off by reselecting this option from the context menu or right-click the table header and select Clear Grouping from the context menu.
Remove this column Removes the column from the view.
Column Chooser This context menu is available on all spreadsheet views of this kind. This option allows you to remove / add columns from the spreadsheet. Click the option and notice the small customization dialog in the view. Now drag and drop a column header from the spreadsheet into the small dialog. It will disappear from the spreadsheet. You can also drag and drop the column header from the dialog back into the spreadsheet. The purpose is to customize the spreadsheet view, based on current requirements.
Hide this column Temporarily hides the column
Show all columns Shows all columns again
Best Fit Resizes the selected column to fit the data exactly.
Best Fit (all columns) Resizes all columns to fit the data exactly.
Filter editor Opens the Filter Editor window.
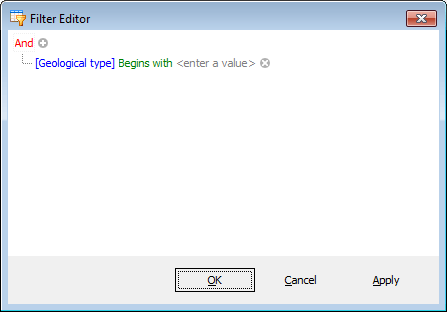
Filter Editor click to enlarge
Show Find panel Opens a find panel at the top of the Marker Table.

Enter search text at top of table click to enlarge
Show Auto Filter Row Displays (or hides) the Auto Filter row.
Units Select the unit for the column data. Option only present for relevant columns.
Format Select the format for the columns data. Option only present for relevant columns.
Ungroup all columns In a grouped table view, this option lets you turn off the grouping layout and return to the normal table layout.
Show Marker Color Show/hides the background coloring for the cells in the Marker column.
Show Wellbore Colors Show/hides the background coloring for the cells in the Wellbore column.
Adding marker sets and markers
To add a new marker set and new marker
- Click into the Marker Set column in the first blank row at the bottom of the table. Type in a name for the new marker set.
- Click into the Marker column and type a name for the new marker.
- Click into the Wellbore column to activate the drop-down box. In the drop-down box select the wellbore that the marker will be associated with.
- Click into the MD column and provide a value for the marker. When finished, press Enter. Once Enter has been pressed the marker set and marker are created and can be accessed in the JewelExplorer under Well Data > Marker Sets. Note that you can also change the depth projection to TVD or TVDSS at the top of the table. When using either projection, enter the depth value in the TVD or TVDSS column.
To add a new marker to an existing marker set
- Click into the Marker Set column in the first blank row at the bottom of the table. Select the marker set of interest in the drop-down box.
- Click into the Marker column and type a name for the new marker.
- Click into the Wellbore column to activate the drop-down box. In the drop-down box select the wellbore that the marker will be associated with.
- Click into the MD column and provide a value for the marker. When finished, press Enter. Once Enter has been pressed the marker is created and can be accessed in the JewelExplorer under Well Data > Marker Sets. Note that you can also change the depth projection to TVD or TVDSS at the top of the table. When using either projection, enter the depth value in the TVD or TVDSS column.
Defining gaps or overlaps due to fault offset or an unconformity
- Click into the Missing column for the marker indicating the fault gap or overlap.
- Type the thickness of the fault gap/overlap. Negative values indicate a gap, positive values indicate an overlap.
- Press Enter to save your entry.